The Insights tab

Where Today and Overview record your numbers, Insights helps you understand them and act on them: what do you really earn, which workplace pays off, what brings in the most, and what should you set aside?

Recording your numbers is one thing; understanding what they actually mean is another. That is what the Insights tab is for. It turns your bookkeeping into answers to the questions that really matter: what am I actually earning, which workplace pays off, what brings in the most, and what should I put aside? Everything comes from the same calculation that sits behind your daily log - nothing is ever calculated separately - and you can view it by week, month, quarter or year.

Insights is split into five parts: My Work, Forecast, Fiscal, Locations and Growth. Let’s go through them.
Your numbers, your pace and your scenarios

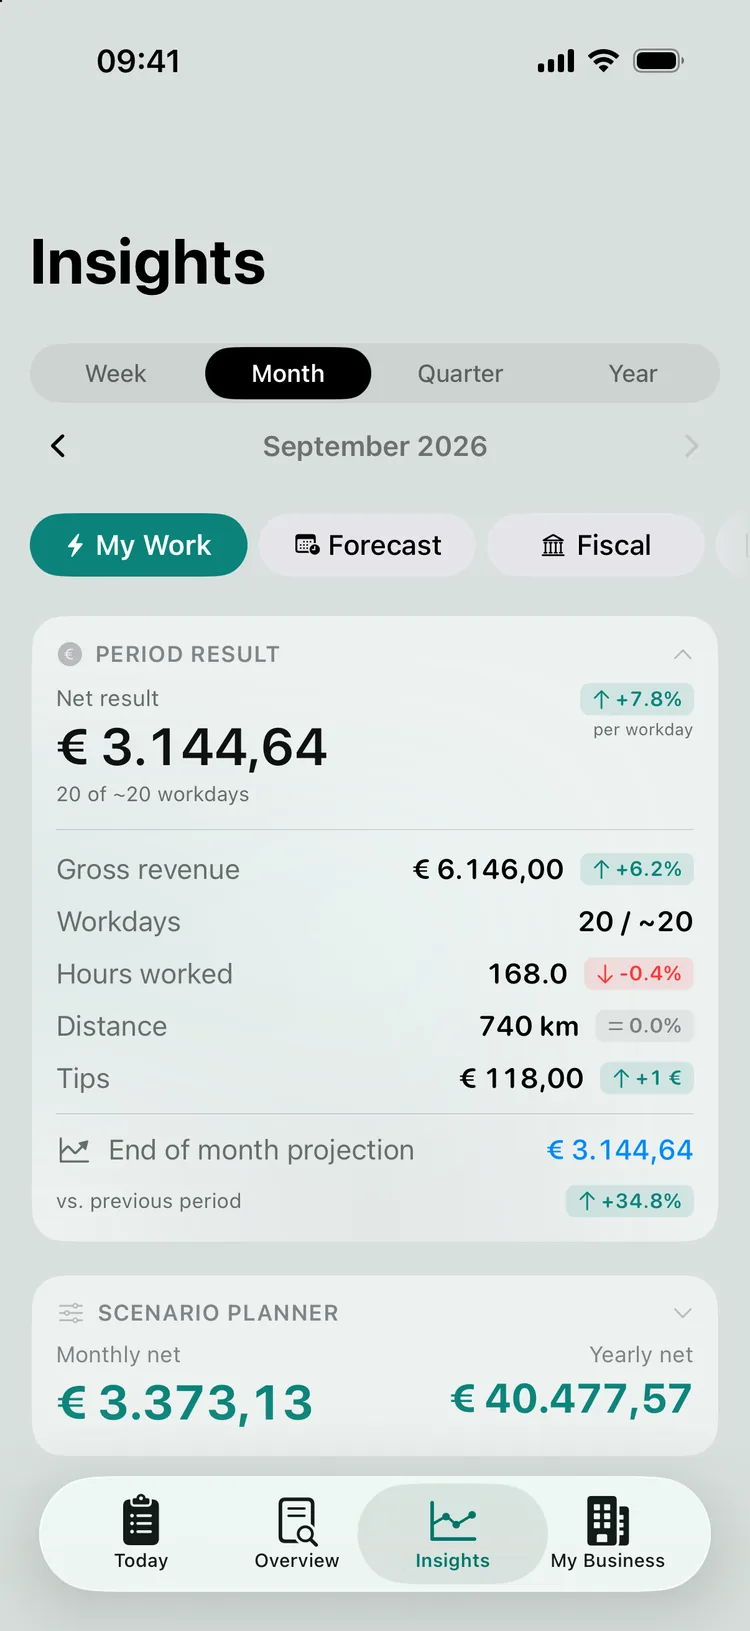
At the top is your Period Result: your net result for the selected period, with the difference compared with the previous period. Expand it and you see the building blocks - gross revenue, working days, hours, distance and tips - each with its own trend. If the period is still running, an End of month projection appears: where you will end up if you carry on at this pace.

If you want to play with it, there is the Scenario planner: adjust your working days, your daily revenue or your arrangements with the host, and immediately see the effect on your net result. You can link goals to it, switch on a seasonal adjustment, and the app works out what it takes to reach a goal - and tells you honestly if you are falling behind. Here you also see your best-performing services and products: what brings in your revenue and how each category contributes.

The expanded Period Result card with gross revenue, working days, hours, distance and tips, and the end-of-month projection.
Your numbers, your projection and a scenario planner to steer with.

Looking ahead at your calendar

Once you have connected your calendar, Forecast looks ahead at your bookings: your occupancy, your busy and quiet days, and - perhaps most useful of all - what your free hours mean in potential revenue. An empty gap becomes an amount, and you know where a promotion or an extra appointment pays off. Forecast is part of Pro; without a connected calendar, the tab invites you to add one.

There is more to it than one paragraph can do justice to - so read Forecast and what it does for you.

Your BTW position and more

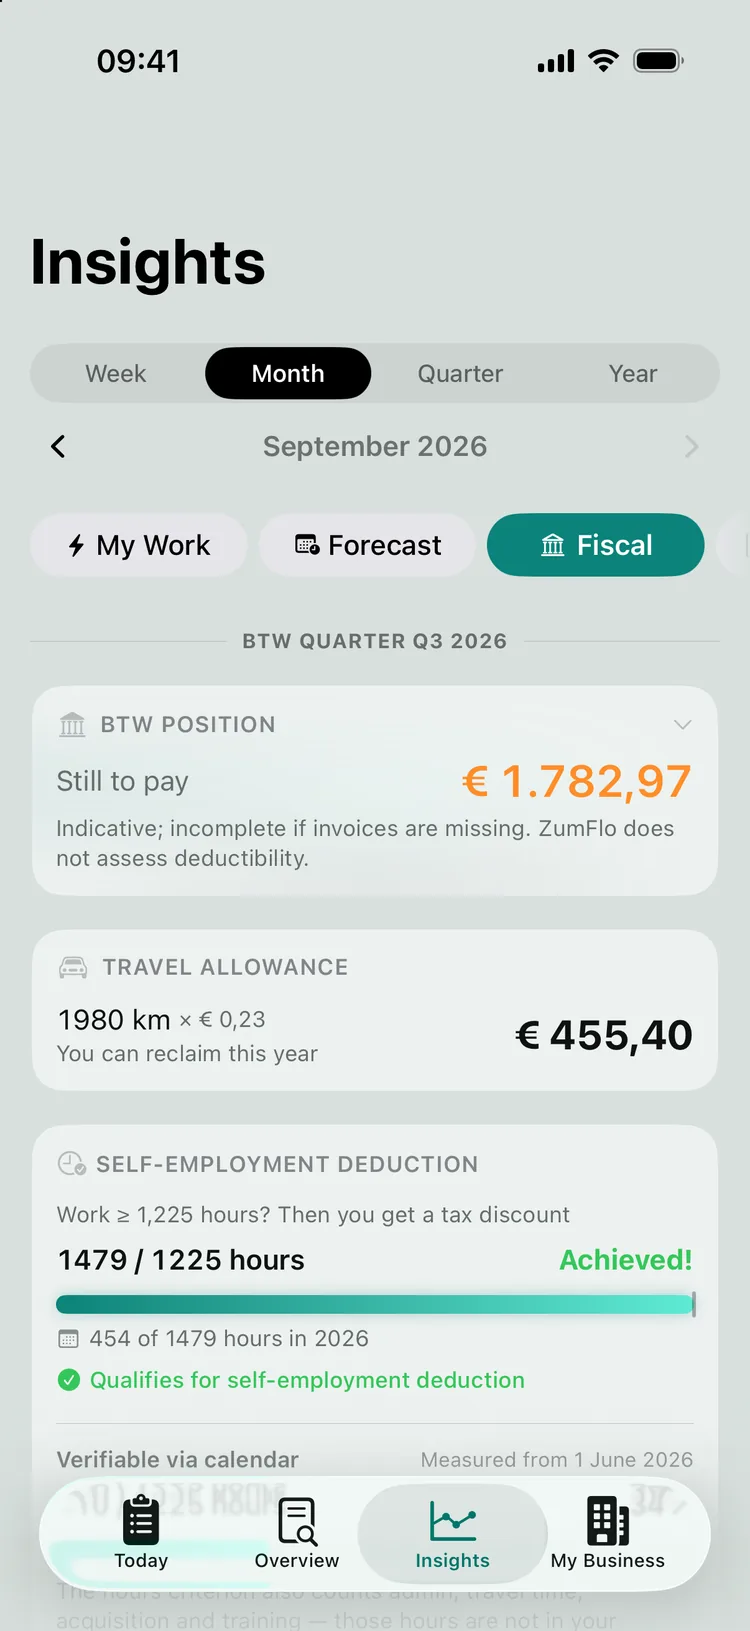
Under Fiscal you will find your estimated BTW (Dutch VAT) position. You see “Still to pay” (or “To be refunded”), made up of “BTW due” - split into 21% and 9% - less “BTW you paid”. Choose the year scope and a breakdown by quarter is added. If you keep track of your purchase invoices (Pro), the picture becomes more complete. Your Travel allowance (your kilometres times the applicable allowance) and, in the Netherlands, your progress towards the Self-employment deduction (the hours criterion of 1,225 hours) are here too.

That way you know roughly where you stand all year round, instead of only when you file your return. Worth remembering, though: this is an indication - the actual, final picture comes from your accountant. The records ZumFlo keeps for you simply make their job a lot easier. How to bundle all this into a file around filing time is explained in quarter- and year-end closing.

The Fiscal tab: the BTW position for the quarter, the travel allowance and progress towards the hours criterion for the self-employment deduction.
Your tax picture all year round - indicative, to help you prepare.

Which workplace pays off

For chair renters this is often the most surprising part. For each host you see your Cost share - the part of your net revenue that goes to the salon - alongside a benchmark that suits your business model. ZumFlo recognises by itself whether your deal is chair rental, commission or hybrid, and places your share in a zone: Healthy, Normal, Attention or Risk. So you know not only what you pay, but whether that is actually reasonable for your type of arrangement.

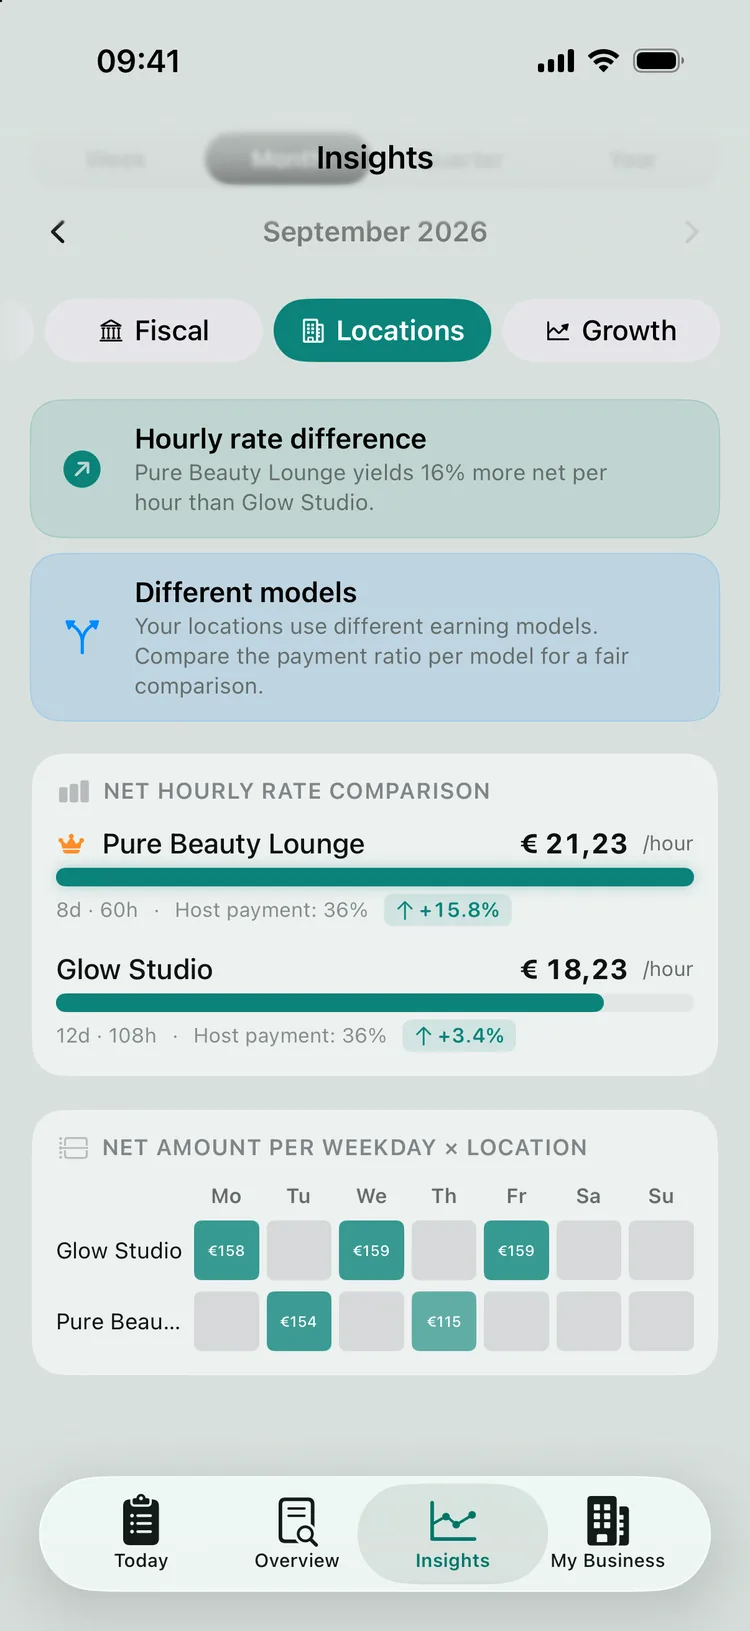
Next to it is “Net Hourly Rate” - your net revenue minus your host payment, divided by your hours. That is the fair figure for comparison: gross revenue distorts, because one host charges commission and another a fixed daily rent. If you work at more than one place, Locations puts them side by side: a profitability ranking per hour, a heatmap by weekday and location, a comparison of your cost structure, and concrete tips (“location A earns more per hour than location B”). With a single location you get an in-depth analysis of that one host instead.

The Locations tab: a comparison of net hourly rate between two salons and a heatmap of net earnings by weekday and location.
Your net hourly rate per location as a fair comparison, with your host payment alongside.

Your progress over time

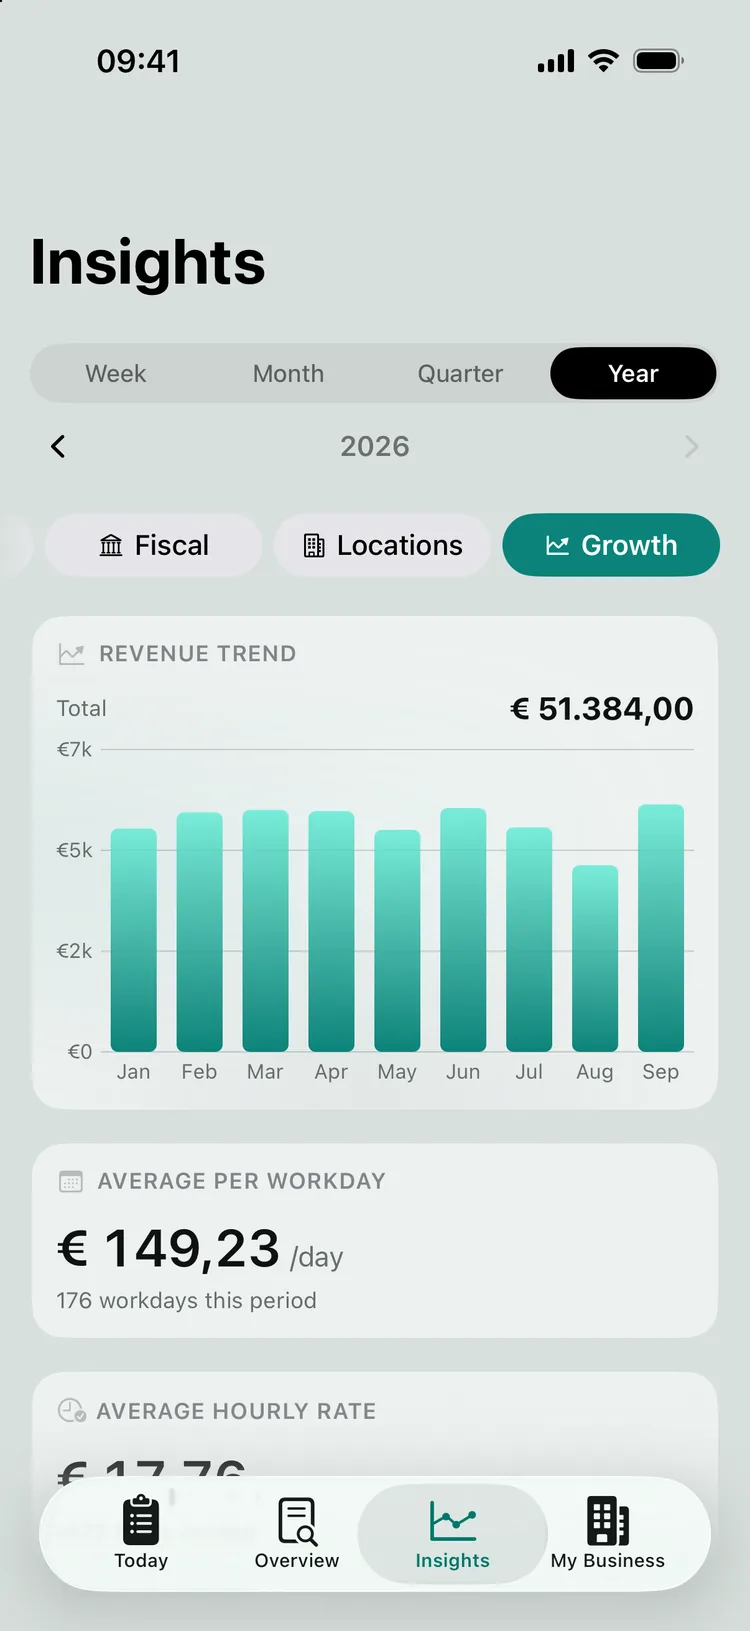
Under Growth you see the longer line: a revenue chart over the period, your average per day and per hour, a comparison with the previous period, and - once you have a year of history - a Year-over-Year comparison. A trend chart over twelve months shows which way your business is heading - handy for telling seasonal effects and growth apart.

The Growth tab at year level: revenue by month and the average per working day.
Your progress over time - revenue by month, with season and trend in a single view.

Honest about the numbers

Two things to keep in mind. First: all forecasts are a projection based on your own history - your actual ratios applied to the future, not a new accounting calculation. They automatically become more accurate as you close more months, and when there is too little data ZumFlo would rather leave a figure out than guess. Second: the tax section is indicative and meant to support you - it does not replace your accountant. That way Insights stays what it should be: an honest compass, not an oracle.

Frequently asked questions about Insights

Your Cost share (in trade terms, the host payment ratio) is the part of your net revenue that goes to your host: net host payment divided by net revenue. What counts as healthy depends on your business model - with pure chair rental a healthy share is lower than with a commission model. That is why ZumFlo shows a benchmark with zones (Healthy, Normal, Attention, Risk) that suit your model, so you see the figure in context.

As your net revenue minus your net host payment, divided by the hours you worked. Because it works on a net basis, it makes locations with different commission structures fairly comparable - gross revenue is exactly what distorts that.

The more history, the sharper. Ratios and trends become useful once you have closed a few months; forecasts borrow your own actual ratios and automatically become more accurate as your history grows. When there is too little data, ZumFlo would rather leave a figure out than guess.

From numbers to answers.

Insights shows you what you really earn, which workplace pays off and what you should set aside - and helps you look ahead instead of working it out after the fact.

ZumFlo gives independent professionals insight into their results, their locations and their net hourly rate.

Download on the App Store
© 2026 Sub37 Labs. All rights reserved. Use of this text without permission is not permitted.